

Ots, M. & Lilleleht, V.
Rarities in Estonia 1998-2000: Report of the Estonian Rarities Committee
Summary: This third report of the Estonian Rarities Committee covers the years 1998-2000, but some earlier records have also been included. Altogether 186 records were definitely assessed (Table 1), and 161 (87%) of these were accepted. The records are listed in systematic order and presented chronologically. Records of birds of unclear origin, escapees from captivity, corrections and changes, and records not accepted are listed separately from the main list of accepted records.
The four numbers in brackets after species’ name (a/b – c/d) indicate (a) the total number of records before 1998, (b) the number of individuals (if possible to judge) before 1998; © the number of records in 1998-2000, (d) the number of individuals in 1998-2000. X instead of a number means unknown number of records or individuals.
The details included for each record are: date(s), locality, parish (khk.), District, number of individuals (is., isend), pairs (paar), nests (pesa) etc. If more than one, sex and age (if known; a = calendar year) and names of observers. The meaning of some estonian terms and expressions: ja = and, läh. = near, jv. = lake, s. = island, laht = bay, (tõenäoliselt) sama isend = (probably) the same individual, pesitsemine = breeding, lõpp = end.
In 1998-2000, 6 new species in an apparently wild state (aerc category a) were added to estonian list: in 1998 Anthropoides virgo, Calandrella brachydactyla (altogether 2 records in the whole period) and Anthus richardi (3), in 1999 Phalaropus fulicarius, Phylloscopus humei and Phylloscopus schwarzi. Also one species of category e (escapees from captivity) – Anas formosa – was recorded for the first time in 2000 in estonia. In the same period the breeding of Dendrocopos medius in Estonia was confirmed.
Altogether, 341 species of apparently wild state or released species which have established self-supporting breeding populations in Estonia or in neighbouring countries (i.e. categories A-C) and five species of unclear origin (category D) have been recorded in Estonia by 31.12.2000.
Lõhmus, A.
Use and quality of natural nest sites of the Tawny Owl in Estonia: nest boxes are not better than tree cavities
Summary: This study (1) presents data on frequency of different natural nest sites and nest trees of the Tawny Owl (Strix aluco) in Estonia; (2) compares its reproductive success in different nest types, particularly in tree cavities and nest boxes. The material originates primarily from the nest record archive of the Estonian Ornithological Society and a special questionnaire to raptor enthusiasts in 2001-2002. Most data are from 1970-2000. Clutch size, brood size, breeding success and total productivity were the analysed indicators of reproductive success. Brood size means the number of fledged or (in case of incomplete data) large young (at least of ringing age). Breeding success was defined as the share of successful breedings (with at least one young fledged) among all breeding attempts. Productivity is the combination of these two variables (i.e., the number of fledged young per breeding attempt).
Sixty-nine percent of the natural nest sites of Tawny Owls (n=98) were situated in tree cavities, 18% in buildings, 6% in top cavities or crotches of trees, and 6% in other locations (Table 1). Typical nest site was a side-cavity in a deciduous tree, most often in a lime (Tilia cordata) in a park or near farm. Such frequency distribution of nest sites was very similar to that in southern Finland, but differed from the latter by the use of open stick nests, which is typical to the Tawny Owls in Central Europe.
Both clutches and broods tended to be larger in the two most common natural nest types (cavities, incl. open cavities, and buildings) than in nest boxes (Table 2). However, in buildings, breeding attempts failed most often (26%, n=31), usually because of nest robbery or disturbance by humans. Also pairwise comparisons of the annual breeding parameters between tree cavities and nest boxes indicated that reproduction tended to be more successful in cavities, although the differences were statistically not significant (Table 3). To summarize, the quality of natural nest sites (particularly tree cavities) of the Tawny Owl is good in Estonia. Given that the number of old deciduous cavity-trees or house ruins has not markedly decreased in the recent decades in Estonia, there is no need for nest-box supplementation.
Elts, J.
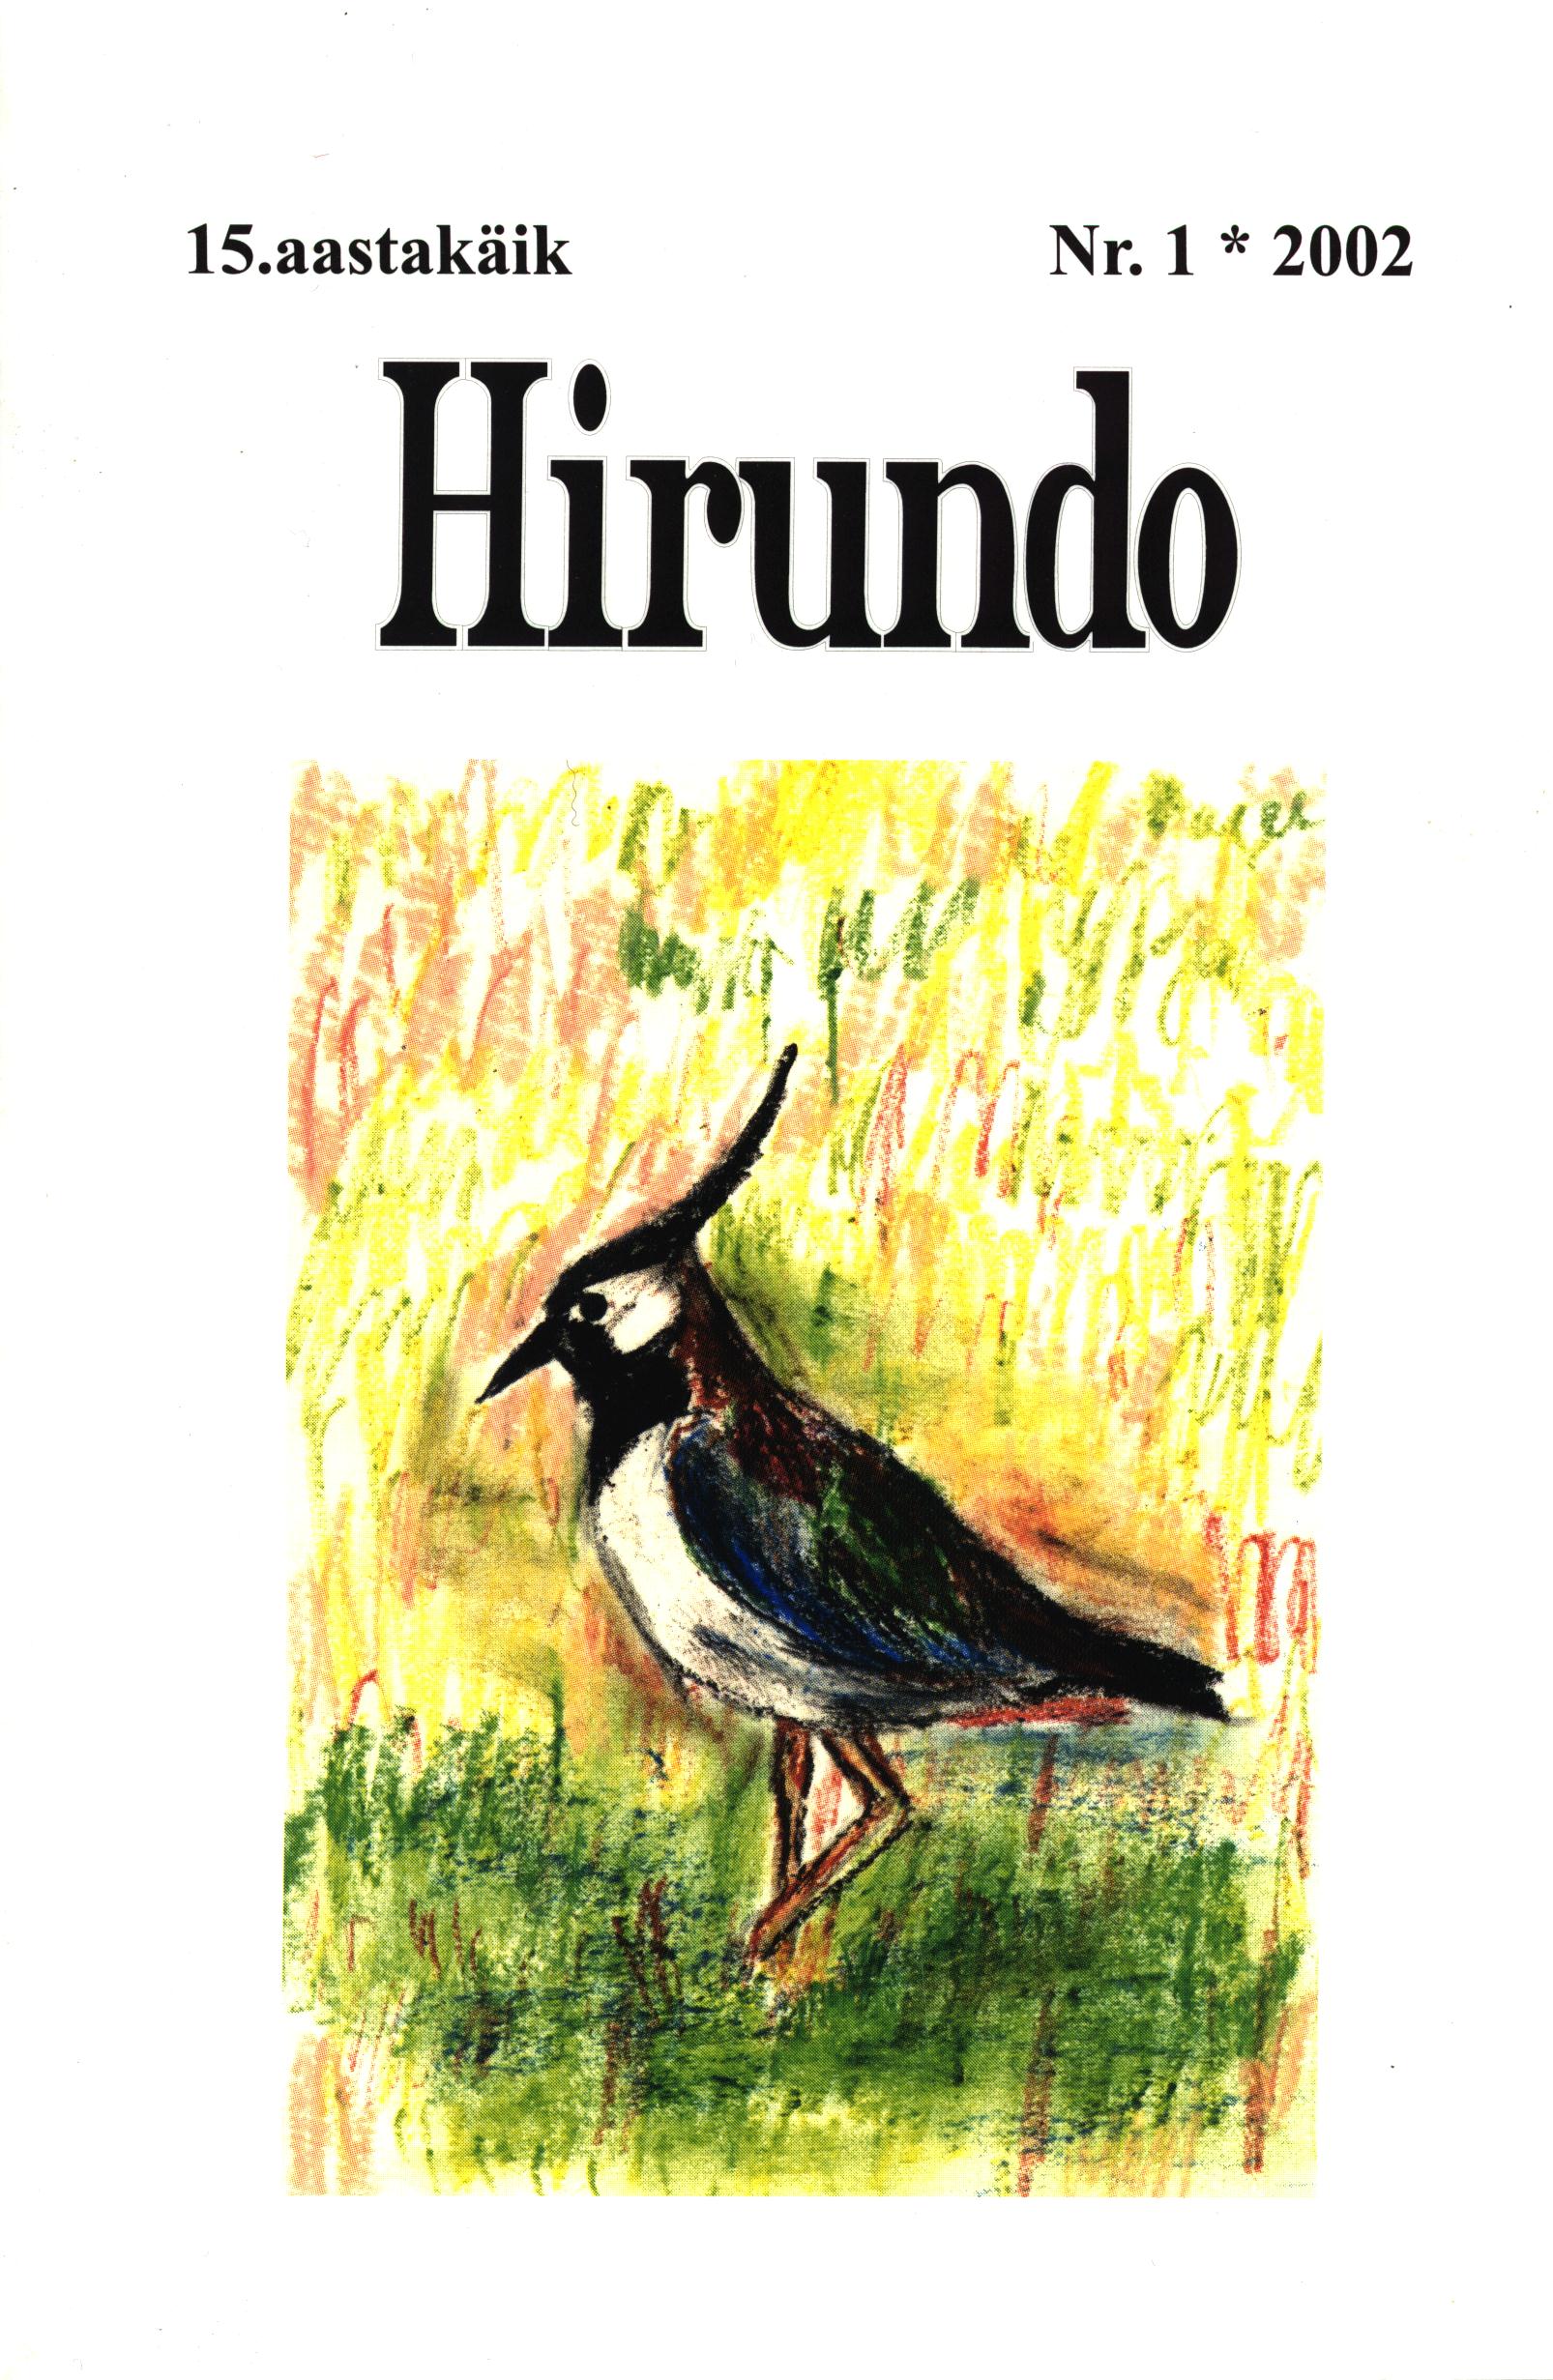
The Lapwing – Bird of the Year 2001
Summary: The Lapwing (Vanellus vanellus) was the Bird of the Year of the Estonian Ornithological Society in 2001. Based on the answers of a special questionnaire, the paper analyses flock sizes and habitat use of the Lapwing in pre- and post-breeding season. Out of 700 distributed questionnaires, 45 were received back; 20 included data about spring migration (75 observations of 925 individuals) and 12 about autumn migration (63 obs., 11 800 ind.).
Most of the observed spring flocks contained up to 20 individuals (Fig. 1). After arrival (in March), the species occurred mostly on grasslands, and less than quarter of all birds were observed on arable lands (Fig. 2). During spring, the importance of grasslands decreased, and in April the birds were more or less equally distributed between the two biotopes. Post-breeding congregations contained mostly up to 400 but occasionally up to 1000 individuals (Fig. 3). In July and August, approximately a quarter of birds were seen on arable lands; the frequency of use of this habitat increased twofold in September but dropped again to about 20% in October.
Elts, J.
Has the departure of Lapwings become later in Estonia?
Summary: The Lapwing (Vanellus vanellus) was the Bird of the Year of the Estonian Ornithological Society in 2001. As a part of the campaign, data about latest autumn observations in 1991-2001 were collected via Internet and special questionnaires. Thirty observations about a total of 4000 individuals were received from western Estonia (Fig. 1). None of the observed birds had visually detectable conditional deviations. Ninety-five percent of the Lapwings were reported in November and only 5% in December; all large congregations occurred in the first half of November. The average flock size was 170 individuals in November and 26 individuals in December (medians 25 and 15, respectively). The last observations were made between 10 November and 16 December, the average of the latest observations being 15 November. The share of the observations from December in the last decade was comparable to the published data from the period 1949-1986 (Rootsmäe & Rootsmäe 1974, 1978, Rootsmäe 1991). In contrast, according to the annually latest observations and assuming that observation quality has remained more or less the same, Lapwings seem to depart later now (Fig. 2; r=0.448; p<0.001). However, it is also possible that after the Second World War the latest Lapwings were not detected because of restricted activity of observers.
Paal, U.
On the bird fauna of Ilmatsalu
Summary: Based on observations from 1992-2002, the paper gives an overview about the bird fauna In the surroundings of Ilmatsalu (26°33’ E, 58°24’ N; Tartu county). Considering also the previously published data, 201 bird species have been recorded in the area, including more than 120 breeding species. The most interesting observations are presented.
Eenpuu, R.
Immigration of the Bohemian Waxwing, Common Redpoll, Snow Bunting and Long-tailed Tit to Estonia in 1996-2001, according to ornithophenological data
Summary: Immigration of four common bird species – Bombycilla garrulus, Carduelis flammea, Plectrophenax nivalis, Aegithalos caudatus – is described according to the results of the ornithophenology project of the Estonian Ornithological Society in 1996-2001. In addition, records of the Snowy Owl (Nyctea scandiaca) and Hawk Owl (Surnia ulula) are listed. Unfortunately it is clear that many observations have not reached the database of the project.
Notes
Tuule, E. & Tuule, A.
On the nesting sites and neighbours of the Kestrel
Lepisk, A.
On the breeding of the Dipper in Taevaskoja
Sild, S.
A brood of seven nestlings in the Barn Swallow
EOS chronicle and news
Mägi, E.
The Ruff on the meadows of Matsalu
Summary: Numbers of the Ruff (Philomachus pygnax) have decreased in whole Europe. In Estonia, the Ruff was a widely distributed breeding bird some decades ago, occupying areas islands, western and northwestern coast as well as alluvial meadows on bigger rivers. In the beginning of the 1990s the breeding number was estimated at about 2000 pairs, and the trend for 1971–90 was stable (Lilleleht & Leibak 1993). Ten years later the estimate was only 100–200 (Lõhmus 2001). Given that Kasari floodplain meadows and the surroundings of Matsalu Bay (Fig. 1) have continuously held the highest number of Ruffs in Estonia, this article (1) gives a historical overview about the status of the subpopulation, (2) describes its breeding habitats, and (3) reviews the history of grassland management and its possible impact on Ruff numbers in the area. Most of the data (incl. about 150 nest descriptions) comes from the systematic censuses of breeding birds since 1958. Earlier data have been collected by Eerik Kumari and some other researchers.
In the 1870s, the Ruff was among the most numerous non-passerines around the Matsalu Bay. In the 1930s, drainage of the Kasari Delta had started, and E. Kumari stated the Ruff as a common breeder (at least 85 pairs) on the Kasari meadow, eastern part of the coastal hay meadows of Matsalu Bay and on larger islands of the bay (Sits 1937, see Fig. 2). In the 1950s, the species had (again) spread widely on the meadows around Matsalu, Topi and Topu Bays, as well as on islands in the bay and in hay-islands in Moonsund. Its numbers reached 940 pairs (Table 1). After such a big increase, decrease started. First, the Ruff disappeared from juniper-rich coastal meadows, then – after grazing was stopped, and open water areas between reedbed and meadows were lost – also from traditional breeding sites in the inner part of Matsalu Bay. In Kasari floodplain meadows, the number of breeding Ruffs started to decrease since 1986–1987. In the last few years, no breeding Ruffs have been detected there but some pairs might still breed. A few pairs breed almost annually in the middle part of Matsalu Bay meadows. The total population estimate for 1997–2001 is 0–15 pairs in Matsalu, and the total Estonian population is obviously much smaller than the last estimate of 100–200 pairs. On migration, the Ruff is still numerous (although less numerous than in top periods) and approximately 12,000 specimens have been counted during migration peak in Kasari meadows, reedbed and on the coast.
In the 1930s, when Ruff numbers were low, they bred only in coastal hay-meadows and in the Kasari flood-plain meadows. Pastures were occupied during population increase; this also coincided with the period when many previously mowed areas were changed to pastures. Most nests have been found from wet meadows with short grass, particularly areas with small ditches. Usually, the nests were in small grass-tufts.
Obviously, there are many reasons for the disappearance of Ruffs. One reason could be global warming and northward shift of its distribution range. However, also habitat change is likely to have big impact. For example, Kasari meadow, from which Ruffs almost disappeared, has been continuously used as hay meadow. However, modern mechanised mowing has resulted in (1) the decrease of mowing area (to 2 500 ha); (2) higher grass – the lowest 15 cm remains now untouched; (3) dense stub-cover of willows (only upper part of is cut down). These changes alter the insect fauna, and old grass and scrub make foraging harder for short-billed birds (e.g. Lapwing and Ruff) and nestlings. From a distance, the meadow looks well managed but for birds, it could be like any other poorly mowed area.
Tuule, E., Tuule, A. & Elts, J.
Numbers and population dynamics of the Lapwing in the surroundings of Saue, 1963–2001
Summary: Breeding Lapwings (Vanellus vanellus) were counted in an approximately 100-km² area in the surroundings of Saue (northern Estonia, near Tallinn), 1963–2001. The landscape is mosaic and the share of open agricultural habitats has increased during the study years. Lapwings were counted in 50 m wide transects. The average annual density (pairs per 1 km²) for the 39 years was 22.1±14.6 (S.D.) pairs in fields, 20.5±19.7 (S.D.) pairs in meadows, 11.0±9.0 (S.D.) pairs in pastures, and 1.5±1.5 (S.D.) pairs in wooded and bushy meadows. Population trends were negative in all biotopes, but particularly strong decrease took place in fields (r= –0.71, p<0.001). Very sharp decline was detected between 1984 and 1985, when Lapwing density dropped 4.7 times in fields, 2.7 times in meadows, and approached zero in pastures and wooded meadows (declines 13 and 16 times, respectively). The most probable reason for this catastrophic decline was high mortality in wintering grounds.
Nellis, R., Nellis, R. & Tammekänd, I.
Numbers and habitat use of wintering Common and Rough-legged Buzzards, Hen Harriers, and Great Grey Shrikes in western Estonia
Summary: In winter 2000/2001, four species of wintering predatory birds were censused in the open landscapes of Saare and Pärnu counties, in order to estimate the size of wintering population in these areas and to explore habitat use of the species. The total numbers were mainly estimated from average population densities for different open biotopes. The mean density of the Common Buzzard (Buteo buteo) in the agricultural landscape of Saaremaa was 0.79±0.39 individuals per 100 ha, in Pärnu county 0.27 and in the other biotopes of Saaremaa 0.44±0.98 ind./100 ha. The average density of the Hen Harrier (Circus cyaneus) was 0.05 ind./100 ha in both counties; the density was 0.08–0.11 ind./100 ha in the Rough-legged Buzzard Buteo lagopus, and 0.32 ind./ha (only Saaremaa counted) in the Great Grey Shrike (Lanius excubitor)(Table 1). Considering the densities as well as potential biases and confusing factors, we estimated the wintering populations for the winter 2000/2001 in West-Estonia as follows: Hen Harrier 20–40 individuals, Common Buzzard 750–1000, Rough-legged Buzzard 40–60, and Great Grey Shrike 500–700 individuals. These numbers are considerably higher than the latest estimates for the whole Estonia, probably as a result of better methodological approach of the current study as well as the mild winter 2000/2001. Common Buzzards preferred to forage rather on set-aside fields (on average, 1.77 ind. per 100 ha) than arable fields (0.59) and wet meadows (0.58), while the Great Grey Shrike was most abundant in arable fields (0.59) and wet meadows (0.58). However, the differences between observed and expected (according to relative cover of habitat types) habitat distributions of these species were not statistically significant.
Väli, Ü. & Laansalu, A.
Numbers, reproductive success and diet of raptors and owls in Härjanurme, Tartu County, in 1992-2001
Summary: Breeding numbers, reproductive success and diet of raptors and owls were studied since 1992 in Härjanurme study area (100 sq. km.), east-central Estonia (58°20’N, 26°25’E). Mosaic agricultural landscape (57%) dominates in the plot; forests cover 22.5%, flood plains 12.5%, mires and water bodies both 3.5%. Breeding territories of raptors and owls were mapped according to their territorial behaviour, repeated observations, nests or fledglings. Reproductive success was estimated with standard methods (e.g. Lõhmus et al. 1997). General diet composition of Buteo buteo, Strix aluco and Asio otus was determined from pellets and prey remains, but insects and bird feathers were excluded from material (birds were initially classified only as non-passerines and passerines). For Accipiter gentilis we used equally bones and feathers. Diets were described by diet width DW = 1/Σpi2 and diet overlap O = Σpijpik / √ Σpij2 Σpik2, where pi is the share of prey species i in the diet, and j and k are raptor species.
Altogether, 13 species (7 Accipitriformes, 2 falcons and 4 owls) were found as breeders (Table 1). The total annual number of breeding territories was 30–55 (mean 44). Species of cultural landscape were most numerous, but also high numbers of Circus aeruginosus were characteristic. Accipiter gentilis and Falco tinnunculus disappeared as breeders during the study. A white morph individual of Buteo buteo bred in the area throughout the study period. Circus cyaneus, Pandion haliaeetus, Haliaeetus albicilla were recorded as vagrants, Buteo lagopus was seen in spring migration.
Reproductive success of five species is summarized in Table 2. In Buteo buteo, productivity (p<0.001) and number of fledglings per successful nest (p<0.001) varied annually but were generally similar to the average values in Estonia.
Out of four species studied, diet of Strix aluco contained the highest numbers of different prey species but diet width was greatest in Buteo buteo (Table 3). Diets of Buteo buteo and Asio otus overlapped by 70%, the diets of Buteo buteo and Strix aluco by 58%, but the diets of the two owl species by only 31%. Accipiter gentilis fed only upon birds (Table 4). Mean body mass of avian prey was different in Strix aluco (65 g), Buteo buteo (158 g) and Accipiter gentilis (375 g; p<0,0001).
Lõhmus, A.
Are estimates of distance to forest edge biased in the data of nest record schemes?
Summary: If birdwatchers tend to look for nests of forest-dwelling birds more often near forest edges than in forest interior, the occasional data in nest record schemes could give biased estimates about habitat use relative to forest edge. In this study, I compared distances to openings from the nests of three raptor species (Accipiter gentilis, A. nisus and Buteo buteo) according to the data of a systematic study in Tartumaa county (east-central Estonia) and the nest record scheme of the Estonian Ornithological Society. The definition of edge (incl. openings as well as forest rides and roads) and distance classes followed those of nest cards. Median tests did not show any significant differences between the two data sets; in A. nisus, the distance to edge tended to be even longer in the nest record data (p=0.12; Table 1). Hence, nest record schemes can give quite realistic estimates of distances to forest edges. A shortcoming of the Estonian card is its inability to distinguish between different edges (e.g. large openings are not separated from rides and narrow roads).
Notes
Leito, A. A white-tailed Eagle attacked a Common Crane
EOS chronicle and news
Elts, J.
Counts of winter land birds in Estonia, 1987/88–1998/98
Summary: The paper summarizes the methods and results of the winter land bird census in Estonia. The census is carried out on transects of unlimited width during three seasons (autumn count between 15 and 28 November, Christmas count between 25 December and 7 January, spring count between 15 and 28 February). In the first years of the project, up to 180 census reports were sent; the number dropped below 100 in the mid-1990s, but is currently increasing again. Most of the transects have been counted in only one winter; 18% of transects have been used in at least five, and 5% of transects in at least ten years. Data analysis indicates that the optimal transect length for Estonian conditions is 8–12 km (see Fig. 5). Numbers of detected birds have been highest in rubbish areas (16.2±6.5 ind. per km of transect, not corrected for visibility), and lowest (less than 1 ind. per. km) in forests, clearcuts, shrub areas and open landscapes. The numbers of 15% of species (out of 48 studied) declined strongly during the winter; in 44% the decline was moderate, in 25% the numbers were stable, and in 17% there was a moderate increase (Fig. 8). Long-term trend was decreasing in seven species out of ten studied (the most abundant species; Fig. 9). The declines were significant in Parus montanus and Pica pica. During the 12 years, the numbers of Pyrrhula pyrrhula increased most, due to the high abundance in the last two winters.
Leito, A. & Ojaste, I.
Migration routes of the Common Cranes breeding in Estonia: first results of colour-marking and radio- and satellite-tracking
Summary: Between 1990 and 2001, 52 Common Cranes (Grus grus) have been colour-ringed in seven Estonian counties. Additionally, radio-transmitters have been attached to eleven birds and satellite transmitters to four. There are altogether 169 recoveries of 26 individuals from eight countries, including 76 recoveries of 20 individuals outside Estonia. The largest numbers of foreign recoveries come from Germany (36 recoveries / 10 individuals), followed by Spain (24 / 6), Hungary (6 / 5), Sweden (3 / 3), France (2 / 2), Poland (3 / 1) and Kaliningrad region in Russia (1 / 1). Forty recoveries of 16 cranes have been made during autumn migration, 21 recoveries of 7 individuals during spring migration, and 15 recoveries of seven birds during winter (see Table 2).
The cranes, grown up in Estonia, use both the western and the eastern migration route (share of recoveries 3:1). So far, only Spain has been identified as wintering area. The marking results indicate that the Estonian and Finnish cranes use similar migration routes and directions, and that the primary migration direction and exact routes are not strictly (genetically) determined. The direction of primary migration of the Estonian and Finnish cranes is between ca. 180°–225°. The western and eastern migration routes as well as the area between them, may be treated as one migration range, where there are no significant movement barriers for birds of the same population. The Estonian (breeding) crane population is an open part of a larger, relatively homogeneous population, which breeding distribution covers at least Estonia and Finland, or (more probably) the whole western part of the range of the species in Europe, reaching Ukraine, Byelorussia and northwestern Russia in the east.
Tuule, E., Tuule, A. & Lõhmus, A.
Numbers of raptors and owls in the surroundings of Saue, 1961–2000
Summary: Since the late 1980s, the numbers of raptors and owls have been monitored in several study plots in Estonia, but earlier data are very scarce. This paper summarizes a 40-year (1961–2000) study in the surroundings of Saue, North Estonia (59°18’N, 24°34’E). The study area is dominated by forests and agricultural habitats, and encompasses 60 km². Its habitat composition has significantly changed during the study (Table 1), especially with respect to seminatural meadows (10.4% in 1961, 0.3% in 1996), wooded meadows (31.5% and 23.4%) and cultivated land (26.2% and 38.3%).
Breeding territories of raptors and owls were mapped according to their territorial behaviour, repeated observations, nests or fledglings. The amount of fieldwork has been generally sufficient (over 200 hours annually) but variable. Despite only a weak correlation (R²=0.09, p=0.06; Fig. 1) between the annual numbers of observation days and territories, the count results have been averaged by four-year periods to establish trends for individual species.
Altogether, 17 species (7 Accipitriformes, 3 falcons, 7 owls) were found as breeders. Their total density (on average 48.2 territories per 100 km²) did not change during the 40 years (R²=0.02, p=0.37; Fig. 2A). In contrast, both the number of breeding species and Pianka’s diversity index decreased significantly between 1961 and 2001 (rs= -0.56, p<0.05, and R²=0.31, p<0.001, respectively; Fig. 2B). Significant negative changes took place in six species (Falco columbarius and Asio flammeus disappeared; the numbers declined in Circus cyaneus, Falco tinnunculus, F. subbuteo and Bubo bubo), while positive changes occurred in only three (Circus pygargus settled to the area; the numbers of Accipiter gentilis and Strix uralensis increased; Table 2). The total numbers of vole-specialized raptors and owls fluctuated annually (peaks in 1965, 1977, 1983, 1991 and 1996) but with no significant periodicity (Fig. 3).
Additional 14 species (8 Accipitriformes, 3 falcons, 3 owls) were recorded only as passage migrants or vagrants. The most frequent non-breeders were Buteo lagopus, Aquila chrysa?tos and Falco peregrinus, while five species (Milvus milvus, Circus aeruginosus, Falco rusticolus, Surnia ulula and Strix nebulosa) have been observed just once. The total number of observations of passage migrants and vagrants has decreased during the study (in the 1960s 49, in the 1970s 49, in the 1980s 15, and in the 1990s 11 obs.).
The changes of habitat composition of the study area are generally typical to Estonia and the trends of several species in Saue match with those found or suggested in Estonia as a whole. The most remarkable exception is the stable or even increasing breeding population of Strix aluco, which has been mostly considered as declining. The difference may be caused by the preserved rural landscape mosaic in Saue; elsewhere the habitat has often become forested or urbanized. The data about general changes in the raptor and owl community have no clear parallels with the few previous reports or notes from Estonia.
Lõhmus, A. & Sellis, U.
Foraging habitats of the Black Stork in Estonia
Summary: According to casual observations in the 1990s, the main foraging habitats of the Black Stork (Ciconia nigra) in Estonia were waterbodies (87.8% of the total of 82 foraging sites), especially rivers, streams and ditches (63.4% of sites). The sites were often situated near roads and even farms, but were usually shaded by forest cover. The Storks foraged on average 3.6±0.8 km (range 0.7–5.9 km) from known nests, but this value is likely an underestimate. Lowered quality of foraging habitats due to forest drainage may be one of the reasons of the decrease of the species in Estonia.
Bird conservation news
Kose, M. Project ‘Nest boxes for European Roller’
EOS chronicle and news
Kose, M.
The Barn Swallow – Bird of the Year 2000
Summary: In 2000, the Barn Swallow (Hirundo rustica) was the Bird of the Year in Estonia. In this paper, the results of the campaign and relevant monitoring projects are presented. The spring arrival of the species was recorded in 25 sites; the first individual was recorded on 15 April. In the monitoring project “Swallows of Home Neighbourhood” (started in 1993) 206 observers all over Estonia participated in 2000. The results of the monitoring project showed a 15% increase in 2000 compared to 1999. In general, the numbers are fluctuating with no significant trend (Fig. 1). The average brood size (4.26) was lower than the long-term average (4.40). Young Barn Swallows fledged on average on 11 July, which is almost the same as in the long term (12 July). According to special questionnaires, the trends in the two latest decades and the importance of different limiting factors are analysed (Figs. 3-4).
Pehlak, H., Luigujõe, L. & Kuresoo, A.
Midwinter waterfowl census in the coastal waters of Estonia, 1994-1999
Summary: In Estonia, midwinter waterfowl censuses were introduced in 1960; now the project is included in the State Environmental Monitoring Scheme. The paper gives an overview about the methods and summarizes the results about species composition, distribution and numbers of wintering waterfowl in the coastal waters of Estonia in 1994-1999. Out of a total of 199 census sites, 134 were surveyed in at least one winter; and more than one hundred people sent their observations annually. Altogether, 35 waterbird species were observed, among which 18 species were recorded every year and five additional species in more than three years (Table 2). Six species occurred in only one winter. Distribution of the most common wintering species is presented on maps (Figs. 4-12).
The importance of each site for wintering waterfowl was assessed as a sum of median numbers of every species on the site divided by their Ramsar criterion 3c value (the threshold numbers of at least 1% of the biogeographical population of the species). According to this, the most important coastal wintering sites are situated on the northwestern coast of Saaremaa Island and the western coast of the Sõrve Peninsula. Valuable sites can also be found on the coasts of Hiiumaa Island as well as the northern coast of mainland Estonia (Fig. 13). Most of the important wintering sites are covered by protected areas or IBAs (Table 3).
Lõhmus, A.
Selection of foraging habitats by birds of prey in north-western Tartumaa
Summary: Only scarce data exist about the foraging habitats of raptors and owls in Estonia. In this paper, the results of regular field observations in 1993-2000 (for the rarest species also from 1991-92) are presented about habitat use and interspecific differences, habitat selection (as revealed from comparisons with available habitat distribution) and relative selectivity of different species. The study area (900 km²) was situated near Tartu, east-central Estonia. Habitat availability was determined by describing 1800 random plots in the field in 1997-2000. Habitat use was measured as the number of observations, defining an observation as one individual in a habitat type at one encounter. The activity of birds was classified as confirmed or probable foraging (bird attacking or following prey, hovering or perching) and possible foraging (flying). Among the total of 1480 observations, five species out of 21 were represented with less than five observations and were omitted from analyses. Habitat selection was measured with the selection coefficient: SKi=log10 (pi / Pi +1), where i is habitat type, p its relative frequency among foraging observations, and P is the proportion of the habitat type in the study area (Gorman & Reynolds 1993). The general selectivity of a species was measured in cluster analysis as the euclidean distance (UPGMA algorithm) between the habitat composition of the study area and of the foraging observations of that species.
Habitat use of the 16 species is presented in Appendix. Pernis apivorus was among the species most often foraging in forest. It avoided cereal crops and other cultivated or man-made habitats. Haliaeetus albicilla used most often (and also preferred) waterbodies as well as flood-plain meadows. Circus cyaneus and C. pygargus preferred cereal fields (both in use and temporarily set-aside) and meadows; the latter species also flood-plain meadows. Circus aeruginosus preferred also open flood-plain meadows, other meadows and cereal fields. The main foraging habitat for Accipiter gentilis and A. nisus was forest; in winter, the latter species was the only raptor regularly hunting in settlements. Buteo buteo characteristically preferred forest openings (forest rides and roads as well as clear-cut areas), but extensively used also meadows and cereal fields. Both Aquila pomarina and A. clanga selected for open flood-plain meadows and other meadows; the first species also for set-aside cereal fields. Mires were the most important foraging habitat for Aquila chrysaetos, and cereal fields for Falco tinnunculus and migrating Buteo lagopus. Falco subbuteo made its foraging flights mostly over forests and flood-plain meadows, while Pandion haliaetus hunted only at waterbodies (incl. over flooded areas). According to visual observations, Strix uralensis mostly hunted from perches (95% of obs.), preferring meadows, forest rides and roads as well as clear-cut areas. The species occurred often near houses, but rarely hunted on flood-plain meadows or mires.
Interspecific differences in habitat use are presented on Fig. 1. According to confirmed or probable foraging cases, the cluster of species feeding mostly upon small mammals was distinct. These species used mostly open agricultural landscape and flood-plain meadows for hunting, whereas other species avoided e. g. cultivated meadows and cereal fields. Seasonal differences in foraging habitat use were small at least in the first species group, with cereal fields having slightly more important role in early spring and autumn than during the summer (contrarily to natural habitats; Fig. 4). This pattern could be explained by changing accessibility of prey due to snow or vegetation.
Foraging habitat use was most similar in the following species-pairs: 1) Accipiter gentilis and Pernis apivorus (mostly forest-dwelling, avoiding cereal fields); 2) the two spotted eagle species (foraging mainly on flood-plains and other meadows); 3) Circus cyaneus and C. pygargus (mostly using meadows, fields, bushy flood-plains and mires with trees); 4) Falco tinnunculus and Buteo lagopus (using mainly cereal fields). As the first species have very different diet composition and the latter are rare, the two spotted eagles and the two harrier species can be considered as potentially competing for hunting sites in the study area.
In preferred habitats the hunting of raptors was more successful (p=0.003). This reveals to the sensitivity of birds of prey to landscape changes, especial-ly in rare species, which were found to be more selective (Fig. 2). However, the population dynamics of the studied raptor community during the 20th century did not correspond to the trends expected by changes in the coverage of different habitat types. This can be due to confounding effects of other factors (e. g. persecution, pesticides, and availability of nest sites).
Väli, Ü.
Quarries as waterfowl habitat in Hiiumaa
Summary: In 1996-1999 the species composition and numbers of waterfowl were studied in six small gravel quarries with permanent water bodies in southern Hiiumaa. 19 species were registered (including seven confirmed breeders, eight probable breeders and four possible breeders; table 2). Charadriiformes were represented with 9 species, followed by Anseriformes (7), Gruiformes (2) and Podicipediformes (1). Several coastal birds were also recorded to breed in quarries. Closely situated quarries formed one habitat unit for Podiceps auritus and Larus canus. I found no statistically significant relation between quarry characteristics and bird numbers. However, the more diverse bird communities occurred in quarries with more irregular shape (p=0.027).
Edula, E.
Relative numbers of passerines in the surroundings of Viljandi, 1996-2000
Summary: In the surroundings of Viljandi, relative numbers of 38 passerine species were assessed by the number of found nests during 1996–2000, comparing the results with those from 1956–1995 (Edula 1998). In the last five years, the numbers of discovered Tree Pipit and Whinchat nests dropped strikingly. There were no signs of recovery in the Marsh Tit, Willow Tit and Crested Tit as well as the Starling and Linnet populations. Wood Warblers still followed their long-term downhill. Comparatively many Dunnock, Garden Warbler and Pied Wagtail nests were found; and Blackbird and Robin populations still continued to increase.
Notes
Lõhmus, A.
How accurate are the density estimates fo forest-dwelling raptors?
Nellis, R., Nellis,R. & Nellis,V.
Common Cranes wintering in Saaremaa
Tammekänd, I.
Wintering Reed Buntings in Pärnu
EOS chronicle and news
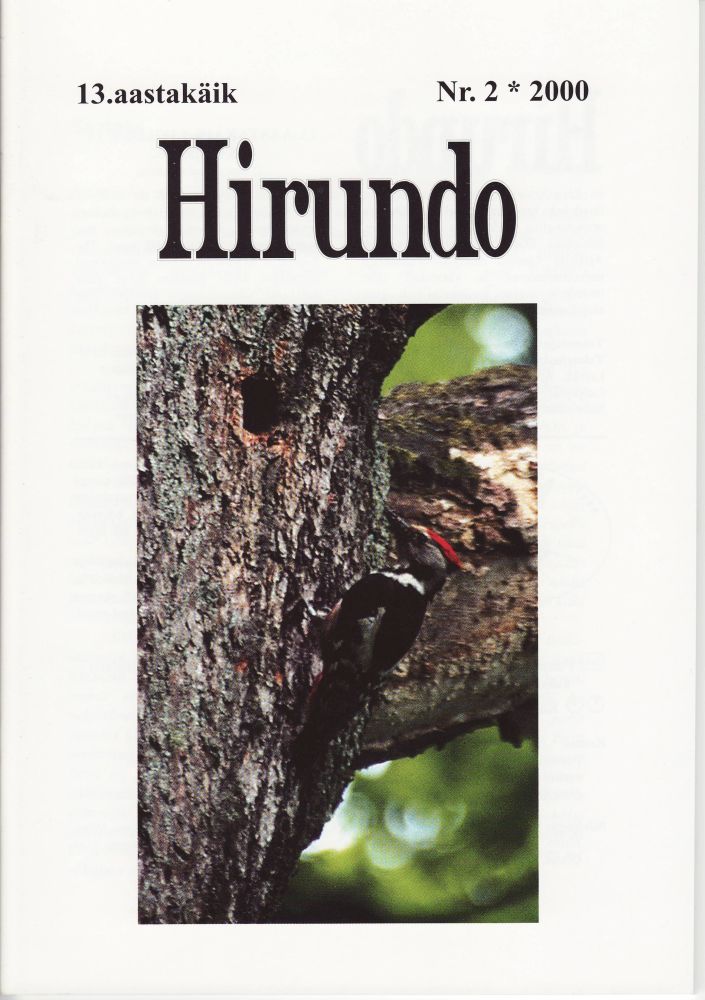
Special issue on woodpeckers
Lõhmus, A., Elts, J., Evestus, T., Kinks, R., Kulpsoo, L., Leivits, A., Nellis, R. & Väli, Ü.
Numbers of breeding woodpeckers in Estonia
Summary: In 1999, the first large-scale mapping of breeding woodpeckers was carried out in Estonia. The numbers of breeding territories were studied in ten plots covering a total of 838 km² (incl. 449 km² of forested land).
All seven species that breed in Estonia were found. The areas of natural forests had almost all (6-7) of them, while mosaics of forests and agricultural areas had only 3-5 species (Table 3). In contrast, the highest total densities (over 200 territories per 100 km² of forest land) were found in forest-field mosaics. This was due to the pronounced dominance of Great Spotted Woodpecker (over 80% of all woodpeckers) there. However, the highest local density was found in the riverine forests of Alam-Pedja nature reserve (altogether 22 territories in fifteen stands with a total area of 1.1 km²).
The total densities of specialised species (i.e. excluding Great Spotted and Black Woodpecker) were highest in natural forest areas (52-63 territories per 100 km² of forest land) and much lower in managed forests (15-34) and forest-field mosaics (23-36). First of all, the difference between natural and man-influenced landscape were distinct in the White-backed Woodpecker (18-30 territories per 100 km² of forest land in natural and 3-9 in managed forest complexes, none in forest-field mosaics).
In general, the study confirmed the latest population estimates (Lõhmus et al. 1998) for the Grey-headed, Black, Lesser Spotted and Great Spotted Woodpeckers. The numbers of Green Woodpecker, which was abundant only on Saaremaa island, seem to be previously overestimated (less than 200 pairs, not 200-300) and those of the Three-toed Woodpecker underestimated (over 1000 pairs, not 500-1200).
During the last 50 years (excluding the second half of the 1990s) the numbers of six forest-dwelling woodpeckers have increased, apparently due to the twofold increase in forest area. At the same time the numbers of Green Woodpecker (and in ecologically similar Wryneck) have sharply decreased, which can result from the loss of seminatural habitats, their main foraging ground. In the nearest future, however, the recent intensification of Estonian forestry is likely to have a significant negative impact on the most sensitive forest species as well (e. g. White-backed Woodpecker). Forest reserve network, which according to Estonian Forest Policy should cover four per cent of forests, is not large and representative enough to avoid these declines.
Lõhmus, A.
Bird of the Year 1999: woodpeckers
Summary: Spotted woodpeckers (Dendrocopos spp.) were the Birds of the Year in Estonia in 1999. This paper summarizes 105 answers to a questionnaire, regarding how widely different species were known, their distribution, numbers and trends. Almost all people knew Great Spotted Woodpecker, which did not breed in only three studied localities. Rare species were much less known by people. The distribution of the Lesser Spotted Woodpecker was more even than that of the White-backed Woodpecker, which was particularly rare in the western archi-pelago, northern and north-western part of mainland Estonia (Fig. 2). Numbers of both latter species have declined in the last decade, in contrast to the stability or increase in the Great Spotted Woodpecker. The Middle Spotted Woodpecker was observed in at least three localities, and finally, in spring 2000, the first breeding of the species in Estonia was confirmed (see Kinks & Eltermaa, this volume).
Elts, J.
Breeding biology of Estonian woodpeckers
Summary: The paper summarizes data on nest sites, clutch and brood size and breeding phenology of seven Estonian woodpeckers. 312 nest record cards of the EOS database have been analysed, the majority (72%) of which represent the records about Great Spotted Woodpecker. From all other species only small numbers of cards are available, and not a single one about Green Woodpecker nests. In the future, observation quality should be improved, one one hand by recording clutch and brood sizes more often, and on the other hand by visiting nests more than just once.
Kinks, R.
Habitat use of woodpeckers in Estonia
Summary: Casual observations (mostly about foraging) of all eight breeding woodpeckers were gathered with a special questionnaire in 1999 and 2000 to explore the habitat use of woodpeckers in Estonia. Altogether 1977 observations from all counties were got, out of which 52% concern foraging, 18% calling, 19% drumming and 11% other activities of woodpeckers.
The foraging sites of Three-toed, Black and White-backed Woodpecker were almost entirely in forests. The relative frequency of managed forests was the highest in the Black Woodpecker and lowest in the White-backed Woodpecker. Majority of the foraging sites of Middle Spotted, Grey-headed and Lesser Spotted Woodpeckers were situated in parks, gardens and other habitats of sparse tree cover. Although Green and Great Spotted Woodpeckers foraged most frequently in forests, they were often observed in parks, gardens and other habitats as well. The species most frequently encountered on ground and at feeders were the Grey-headed and the Green Woodpecker.
The Great Spotted, Black and Three-toed Woodpecker foraged more often in coniferous than in deciduous stands, while the Middle Spotted and White-backed Woodpecker mostly foraged in deciduous stands. The Black and Three-toed Woodpecker also foraged most frequently on coniferous trees, contrarily to Grey-headed, Middle Spotted and White-backed Woodpecker that used deciduous trees most often. Dead wood as foraging substratum was most often used by the Black and White-backed Woodpeckers.
Differences between winter and summer foraging sites were most pronounced in the White-backed and Three-toed Woodpeckers. In winter, the White-backed Woodpecker foraged more often on dead wood, while the Three-toed and Great Spotted Woodpecker used more deciduous trees in that season.
Kinks, R & Eltermaa, J.
Middle Spotted Woodpeckers in Räpina
Summary: In 2000, three Middle Spotted Woodpeckers were caught and ringed in Räpina park (SE-Estonia) and the first breeding case of the species in Estonia was confirmed. The nest was situated in living oak at 5.6 m in height. Nest-building started on 18 April, eggs were laid on the first week of May, nestlings hatched on 18 or 19 May. Both adults participated in nest-building, incubating and feeding of young. Food was brought to young on average after every 12 (1-49) minutes. The brood failed – two dead nestlings were found in the nest on 6 June.
Lõhmus, A., Elts, J., Evestus, T., Kinks, R., Nellis, R. & Väli, Ü.
Techniques for woodpecker census
Summary: Among birds of conservation concern, woodpeckers have been one of the least studied groups in Estonia. The paper gives an overview of woodpecker census techniques (based on literature and authors’ experience) and develops recommendations for Estonia. Using tape records of drumming, playback census of territories should be carried out in 10*10 km squares between mid-March and mid-May. In our pilot study all species responded almost equally well to the drumming of male White-backed Woodpecker (Fig. 3). Additionally, it is recommended to search for nests and to use occasional observations that could indicate territories. The paper briefly reviews the possibilities to use foraging tracks, and some problems with data interpretation and species identification.
Notes
Koppel, A.
Food of the Great Spotted Woodpecker in a Pinus nigra stand
Põldsam, H.
Great Spotted Woodpecker destroying a nest of Tree Sparrow
Põldsam, H.
Birds at salt feeders
EOS chronicle
Kuresoo, A. & Ader, A.
The point counts of breeding land birds in Estonia, 1983-1998
Summary: The Estonian point counts are aimed at monitoring long-term trends in breeding bird populations, which also reveals changes in bird habitats and the environment in general. Between 1983 and 1998, 72 birdwatchers of the EOS participated in the project, covering a total of more than a hundred routes. The average “life-span” of the routes exceeds seven years and 26 routes have been checked in at least ten years. Changes in the observers’ activity are shown on Fig. 1. The number of records (according to the summer count, 25 May-20 June) was at its highest in 1986-1990, decreased in the next five years and has stabilised recently.
The analyses were made with program “TRIM/Trends and Indices for Monitoring Data” (vers. 2.0 for Windows). On the basis of the summer count population indices (PI), which compare the numbers with those in 1983, were calculated for most numerous species. In appendices 1-2 the indices are presented for 55 species, including 33 species of “early breeders” (mostly resident and short-distance migrants) and 22 species of “late breeders” (mostly long-distance migrants). For many species, the trends are presented on Figs. 2-3. Data on some more scarce and aggregated species (>40% of pairs counted in a few routes and on the average less than 50 pairs counted; Table 1) should be treated with caution.
According to the long-term trends, the species were divided into six groups (Table 2). If the numbers (by linear trend) did not change more than 25% in 1983-1998, the population was considered to have been stable. In 1983-1998, large increases (>50%) were observed in breeding Columba palumbus, Dendrocopos major, Troglodytes troglodytes, Erithacus rubecula, Turdus merula, Garrulus glandarius, Corvus corax, Sylvia communis and Carpodacus erythrinus populations in Estonia. In the same period, alarming (>50%) decreases were observed in Oriolus oriolus and Gallinago gallinago, significant decreases also in Anthus trivialis, Hippolais icterina, Phylloscopus sibilatrix and P. collybita.
Table 2 also presents comparisons with the trends in Finland, Sweden and Denmark. 75% of resident and short-distance migrant species had similar trends in Estonia and the Nordic countries and only 8% had completely different trends. In general, most of these species have occurred in stable numbers both in Estonia and the Nordic countries, although many species have fluctuated significantly. Trends of long-distance migrants coincided much less frequently in different countries.
Sellis, U.
Will the Black Stork remain to breed in Estonia?
Summary: The Black Stork (Ciconia nigra) is at the north-western border of its distribution range in Estonia. The paper summarises data on its numbers and distribution in Estonia in 1999, reproductive success in 1991-1999, and results of the special Bird of the Year project in 1998. The latter, which was aimed at rising public awareness and gathering additional data, resulted in three new nest sites and a total of 62 territories counted. The main result, however, was propagation success – in public opinion the Black Stork was among the most well known protected species in 1999.
The numbers were estimated at 100-120 pairs in 1999, which is 2-2.5 times less than two decades ago (see Renno 1993, Lõhmus et al. 1998). Distribution concentrated into the largest forest areas rich in rivers and streams (Fig. 1). The population decline coincided with low productivity in the last decade, on the average 1.09 young per occupied (at least some nest-building activity registered) nest and 44% of nest sites successful (Table 1). Trends in all reproductive criteria were negative (although not statistically significant), except the number of dead young in nests, which was highest in the years of summer droughts (1994-1997; Fig. 2). Most probably the reasons of decline and poor reproduction are in our breeding grounds, because some other populations that use the same migration route and wintering areas are increasing. Productivity in the neighbouring countries is as poor as here (Fig. 3), thus, there is no potential for immigration.
Characteristically to declining population, the reproductive rates in Estonia fluctuated widely between years. Therefore, it is important to monitor the population every year. However, in the 1990s state monitoring program covered the Black Stork only in 1994 and 1999, which are not representative, as these happened to be the best years for breeding (Table 1).
In general, the status of the Black Stork in Europe is alarming. Decreases in the previous source-populations of Poland and the Baltic States are not compensated by increases in other, much smaller populations (Strazds et al. 1995). For conservation, it is important to find out the reasons of declines, which probably will be successful only by international co-operation. The study and (especially) conservation of the Black Stork in Estonia is carried out by two closely co-operating NGOs, the Eagle Club (urmas.sellis@mail.ee) and the Nature Conservation Society “Kotkas”. Legally, the Black Stork is included in the strictest conservation category (I) and the state, represented by the Ministry of the Environment, is responsible for organising the conservation. Probably, the national management plan for the Black Stork will be compiled in 2000.
Lõhmus, A.
When, and how, do Ural Owls call?
Summary: Vocal activity of the Ural owl (Strix uralensis) was studied near Laeva (ca 28°27’ N, 26°19’ E) in 1991-94 (occasional data from 1983-90 and 1995-98). Near the known nest-sites, territories were checked during at least ten minutes for any vocal activity, and the intensity of calling was measured as the probability of detecting a territory. Most observations were made after sunset in the evening. In addition, the repertoire was quantitatively described, using a “call cycle” (all calls of one adult during an hour) as a counting unit. The start of calls was determined in the cases when a territory was listened for several hours in the evening. Everywhere, time is expressed as East-European summer time.
Calling was significantly more intense in spring (recording probability 36%) than in summer (11%), autumn (8%) and winter (6%). The data did not reveal higher activity in autumn, which is documented in the Tawny owl (Strix aluco) and claimed to occur also in the Ural owl. Also, the frequency of territorial calls was much higher in spring (Table 1) than recorded by Lundberg (1980) in Sweden, suggesting that territorial activity in the study area mostly occurred in spring. Within breeding period, the vocal activity remained on high level from March to early May (Fig. 1). In March 1993 calling was more active than in 1991, 1992 and 1994. The reason could be that 1993 was a good vole year, although some later results (e. g. in 1999) do not support this. Instead, the difference can be a result of better weather conditions in 1993.
Wind and rain strongly influenced the vocal activity (Fig. 2). In addition, the air temperature and cloud cover seemed to be of importance, but their effects were not significant statistically. These results are in accordance with other studies.
The start of calling was associated with sunset (Figs. 3-4). Calling started on the average 19 ±10 minutes after sunset in spring, but relatively later in winter. Similar pattern has been described in the Tawny owl (Hansen 1952).
The repertoire was sexually diverse but did not change significantly during the year (Table 1). Especially in breeding season, males were much more vocal than females.
In Estonia, monitoring of owls has been mainly based on territory mapping via spontaneous calls. According to rough calculation, using also the data by Lundberg (1980), during ten minutes of listening about 20% and during twenty minutes up to 40% of Ural owl territories could be detected in spring. However, this means that the locations of (potential) territories are known in advance. Whenever possible, searching for nests and playback-method should be used as additional tools in owl counts.
Edula, E.
Breeding of the Linnet in the surroundings of Viljandi
Summary: In 1959-1998, the author has studied Linnets (Carduelis cannabina) near Viljandi, south-central Estonia. The numbers of Linnets peaked in the 1960s and have dramatically decreased since then (see Edula 1998).
The spring arrival has taken place between 14 March (1967) and late April, on the average on 4-5 April. The breeding season was very long and probably included several clutches (Fig. 1). More than 40% of clutches were laid before 15 May, and 31% of clutches between 16 May and 15 June. Only 12% of clutches have been laid after 15 July. Laying lasted seven, incubation 10-14 and nestling period 11-14 days.
Majority of nests were situated in spruce hedgerows along roadsides, but also in cemeteries, single trees etc. Only few nests were built on deciduous trees or bushes. Usual height was 0.7-1.3 metres (range 0.4-2 m) above ground. The average measurements of 32 nests were: diameter 11.7 × 10.1 cm, height 7 cm, depression diameter 6.1 × 5.7 cm and depression depth 4.1 cm.
The average size of 613 clutches was 5.12 (range 2-7). Largest clutches were laid between 16 May and 15 June, the latest clutches were the smallest ones. However, this difference was not observed in the proportion of successful nests (Table 1). Altogether, 68% of nests were successful (n=382). In long term, both the clutch size and breeding success followed the changes in numbers, being at their highest in the late 1960s and showing a decline since then (Fig. 2).
Nellis, R. & Nellis, R.
Winter birds in the surroundings of Maleva
Summary: Numbers, trends and habitat use of winter birds were studied near Maleva village (58°19’N, 22°31’E) in Saaremaa, 1992/93-1998/99. Three transect counts during winter were performed. 42 species occurred, nine of them in 70% of counts. The average density was 29 ind. per km but it varied a lot. Birds were most abundant in settlements although the numbers decreased significantly during winter there. Decrease during winter was not correlated with climate, and it was not smaller than in Saue, mainland Estonia, despite the milder climate of Saaremaa. Long-term changes in bird numbers coincided mostly with those reported about whole Estonia.
Notes
Aua, J.
Food parasitism in the Mistle Thrush
Elts, J.
Antagonistic behaviour between the Fieldfare and the Blackbird
Lõhmus, A.
A buzzard laid egg without shell
Aua, J.
On the breeding phenology of the Little Ringed Plover
Aua, J.
A clutch of eight eggs in the Barn Svallow
EOS chronicle and news
Lilleleht, V.
Rarities in Estonia 1990-1997: report of the Estonian Rarities Committee
Summary: This second report of the Estonian Rarities Committee (founded in 1977) covers the years 1990-1997, but many earlier records have been also included. Altogether 759 records were definitely assessed (Table 1), and 624 (82%) of these were accepted. From the period 1990-1997, 597 records were considered (44-105 records annually), of these 544 (91%) were accepted. In different years the frequency of accepted records was 76-99%.
The records are listed in systematic order and presented chronologically. Records of birds of unclear origin, escapees from captivity, corrections and changes, records not accepted, and records formerly accepted but now rejected are listed separately from the main list of accepted records.
The four numbers in brackets after species’ name (a/b – c/d) indicate (a) the total number of records before 1990, (b) the number of individuals (if possible to judge) before 1990; © the number of records in 1990-97, (d) the number of individuals in 1990-97. X instead of a number means unknown number of records or individuals.
The details included for each record are: date(s), locality, parish (khk.), district, number of individuals (is., isend), pairs (paar), nests (pesa) etc. if more than one, sex and age (if known; a = calender year) and names of observers. The meaning of some Estonian terms and expressions: algus = beginning, lõpp = end, ja = and, läh. = near, vahel = between, jv. =lake, s. = island, laht = bay, kuni = up to, pesakond = brood, (tõenääoliselt) sama isend = (probably) the same individual, pesitsemine =breeding, pesitsusaegsed teated = records from breeding period.
In 1990-1997, 13 new species in an apparently wild state (AERC category A) were added to Estonian list: in 1990 Neophron percnopterus, Rissa tridactyla (altogether 10 records in the whole period), Motacilla citreola (10) and Acrocephalus agricola (4), in 1992 Gavia adamsii (12), Anthus hodgsoni and Acrocephalus paludicola, in 1993 Aquila nipalensis and Luscinia megarhynchos, in 1996 Pluvialis fulva (3) and Pagophila eburnea and in 1997 Himantopus himantopus and Sterna nilotica. In 1990, the race variegata and in 1993 the race maura of the Stonechat (Saxicola torquata), and in 1991 the American race columbianus of the Tundra Swan (Cygnus columbianus) were for the first time. Also one species of unclear origin (category D) – Bucanetes githagineus – was recorded for the first time in 1997 in Estonia.
The records of Platalea leucorodia, Rhodostethia rosea and Dendrocopos medius were second records for the country. The records of the race Branta bernicla hrota were the third to fifth, of Tyto alba third to fourth, of Tarsiger cyanurus third, of Saxicola torquata third to fifth, of Hippolais caligata third, of Phylloscopus fuscatus third to fifth, whereas those of Burhinus oedicnemus and Phylloscopus borealis fourth to fifth in Estonia.
In the same period the breeding of Aquila clanga, Motacilla citreola and Panurus biarmicus in Estonia was confirmed, as well as an accidental breeding of Calidris temminckii in 1993. On the other hand the single formerly accepted nesting record of Aythya nyroca in the country (in 1974) was reviewed and rejected.
Altogether, 335 species of apparently wild state or released species which have established self-supporting breeding populations in Estonia or in neighbouring countries (i. e. categories A-C) and five species of unclear origin (category D) have been recorded in Estonia by 1.1.1998. The whole list of Estonian bird species and list of those considered by the Estonian RC was published earlier.53 The list of species and subspecies of which only earlier records will be considered by the RC is given as Appendix 1.
EOS chronicle and news

Edula, E.
Breeding biology of the birds in artificial nests in the surroundings of Viljandi, 1968-1987
Summary: Nest-boxes have been put in the gardens and woods near Viljandi. Since 1970 there have been permanently about 200 boxes: three large for owls, 20 for starlings and the remaining for small passerines. The area and bird population dynamics have been described in Edula (1998), and the earlier (1956-1967) results about breeding biology in Edula (1969).
In different years 45-87% of the boxes were occupied, altogether by 14 bird species. Regular breeders were the Starling, Pied Flycatcher and Great Tit; also the Wryneck (no breeding records in the latest years), Marsh Tit and Tree Sparrow often nested in boxes. Occasional breeders were the Tawny Owl, Robin, Willow Tit, Crested Tit and Blue Tit, Nuthatch, Treecreeper and House Sparrow. The recorded clutch sizes are summarized in Table 1.
Tawny Owl. Out of nine breeding attempts (breeding was considered to begin with laying) seven were successful, producing on the average 2.3 young per breeding attempt.
Wryneck. The eggs were usually layed between 21 May and 6 June (earliest 18 May 1975, latest 20 June 1971). In addition to 25 successful attempts which produced on the average 6.6 young, the breeding failed in ten cases.
Starling. Laying starts mainly in the late April or early May (Figure 1). Long-term dynamics in the clutch size and breeding success are presented on Figure 2. The largest clutches (8 eggs) were observed in 1968 and 1969. In 1970-1987 208 breeding attempts (189 successful) produced on the average 3.7 young per attempt.
Pied Flycatcher. This species is the most numerous in the nest boxes. It arrives between 23 April and 9 May, and starts to breed in the second half of May (Figure 3). Long-term dynamics in the clutch size and breeding success are presented on Figure 4. The average clutch size was similar to that in 1956-67. The largest clutch (13 eggs) was probably layed by more than one female. Average measurements of 201 eggs were 17.71×13.35 mm, weight of 102 eggs 1.53 g. The incubation period lasted usually 13-14 (12-18) days (n=31), the whole period between the laying of the first egg and the
leaving of young was 32 days. Altogether 3.8 young fledged per breeding attempt (n=1352; out of these 953 were successful).
Robin. The breeding in nest boxes was confirmed in 16 cases. Ten successful attempts produced on the average 5.4 young per successful attempt.
Marsh Tit. Laying started usually between 23 April and 7 May; the incubation lasted 14 days (one observation), and the nestling period 20 days (two observations). 28 nests out of 42 were successful, producing on the average 6.2 young per successful nest.
Willow Tit. Most nests were situated in snags, nest-boxes were inhabited in 15 cases. Laying started between 1 and 24 May, incubation lasted 12-14 days (n=4). Ten nests were successful, the average number of young per successful nest was 5.3.
Crested Tit. Usually nests in snags, but 25 nests were found also in nest boxes. Usually laying started in the third decade of April; incubation lasted 14-15 days (n=3). Only nine nests were successful and on the average 4.8 young fledged per successful attempt. The average measurements of 13 eggs were 16.02×12.39 mm.
Blue Tit. Only 15 nest-box breedings have been recorded. Laying started between late April and mid-May. Nine attempts were successful, on the average 8.3 young fledged per successful nest. Great Spotted Woodpecker predated three clutches completely and one partly.
Great Tit. Many birds lay two clutches (Figure 5). Incubation starts differently in first and second clutch; it lasted 9-16 days (n=37), usually (n=21) 12-13 days. The long-term dynamics in the clutch size and breeding success are presented on figures 6-8. The average measurements of 152 eggs were 17.92×13.44 mm, weight of 86 eggs 1.64 g. On the average, 5.9 young fledged per first (n=552) and 5.5 young per second clutch (n=301); per successful attempt 7.3 (n=427) and 6.3 (n=258), respectively. The eggs of the first clutch tended to fail more often, possibly because of more intensive predation by Great Spotted Woodpecker.
Treecreeper. Has nested in nest boxes only twice.
Nuthatch. Six out of nine clutches were successful, producing on the average 4.29 young per successful attempt.
Tree Sparrow. Breeds up to three times in a season, clutches have been found from April to late July. In the first half of the study period the nests were persecuted systematically. 30 successful clutches yielded 4.6 young per successful attempt. The average measurements of 176 eggs were 19.66×14.75 mm.
House Sparrow. One breeding case (in 1968).
Lõhmus, A.
Monitoring of raptors and owls in Estonia, 1994-1998
Summary: Although in a few plots raptors and owls were studied already in the 1960s in Estonia, the monitoring has developed markedly only since 1989. In 1994 monitoring of raptors and owls at permanent study plots became a part of National Monitoring Scheme. This paper analyses the development and results of the project in five years (1994-98), and compares it with earlier data.
The project includes mapping the breeding territories (BT), checking potential nest sites and recording productivity of raptors and owls. At least 24 plots were studied in 1994-98 (Fig. 1). Although the locations are not randomly selected but determined by distribution of observers, the plots’ habitat composition is similar to Estonian average. Usually a plot follows UTM-grid square and covers 100 sq. km-s. If not studied for the first year, at least 150-200 work hours per 100 sq. km-s was needed to map the BT-s, and at least 250 hours to find 50% of nests (Fig-s 2-3).
The average breeding densities were calculated from average densities in every plot. Trends for most common species were reconstructed by comparing total numbers in plots studied in two subsequent years which were then standardized to the 1993 level. In general, potential nest sites were checked according to Haapala & Saurola (1986), the breeding results were recorded according to Lõhmus (1997a). Productivity is defined as number of fledglings per occupied nest.
The average breeding densities are presented in Table 1, occupancy of potential nest sites in Table 2, and average productivity in Table 3.
Coefficient of variation of densities in different plots gave the following order of distribution uniformity: Common Buzzard (35%), Honey Buzzard (43%), Sparrowhawk (48%), Hobby (52%), Goshawk (58%), Tawny Owl (80%), Long-eared Owl (82%), Ural Owl (100%), Montagu’s Harrier (104%), Kestrel (117%), Marsh Harrier (125%), Lesser Spotted Eagle (130%), Pygmy Owl (149%), Tengmalm’s Owl (173%), eagles (without Lesser Spotted) and the Osprey (186%), Hen Harrier (225%), Eagle Owl (231%), Short-eared Owl (387%), Merlin (400%).
The average densities in 1989-93 and 1994-98 were similar in most cases. The sharp decrease in Merlin, however, seems to have continued, and its present population in Estonia is estimated at 10-20 pairs (Lõhmus et al. 1998). Probably the numbers of Short-eared owl have decreased, too.
Evaluating trends by the samples of two subsequent years (Fig.-s 4-5) includes high risk of mistakes. When I eliminated the pair of largest change in every species, only decrease in the Goshawk and increase in Tawny Owl remained significant. In the first species also productivity has dropped, and I propose that it is mainly due to intensified forestry in the 1990s. The Tawny Owl population could have been restoring from impact of hard winter 1986/87.
The fluctuations in Long-eared Owl population are evident (Fig. 5). This overlaps with the three-year cycle of microtine voles which influenced productivity in several species, and occupancy of nest sites at least in two owl species. The top years in most of Estonia were 1990, 1993 and 1996, and minimum years 1989, 1992, 1995 and 1998 (or 1997). However, locally (e. g. near North-Estonian coast and in extreme south-eastern Estonia) the timing of cycles has been different.
In several aspects the productivity data overlaps with earlier results of a thorough local survey (Lõhmus et al. 1997). In this study, however, the productivity of Goshawk and Hobby was lower, and that of owls is overestimated as non-laying pairs were not taken into account.
The main conservation implications of the project were that 1) it allows monitoring of numbers of at least 16 and productivity of 11 species, and the further prospects for larger samples are good; 2) Merlin could have fallen into category of endangered species, there is a need for special survey and conservation plan for the species; 3) the Goshawk population will probably decrease significantly in the following years as possibly also the Lesser Spotted Eagle and Eagle Owl populations.
Elts, J. & Aua, J.
Roding of the Woodcock in Kuhjavere
Summary: On 3-12 April 1998 roding woodcocks were studied in a permanent station in Kuhjavere (Viljandi county). Every evening, between 20.30 and 21.30, the number of birds seen or heard (hereafter: contacts) was determined.
The timing of the roding flights is shown on Figure 1. The first five days were cold and no flights were detected at all. The first flight was observed on 8 April, followed by one day of no activity. The flights became regular since 10 April. A significant rise in roding intensity took place on 14 April, but on 17 April the number of contacts was again similar to that of 13 April. The following intensification turned to a continuous decline up to the end of the period.
In different evenings 0-20 contacts were counted. It is not known whether the woodcocks had arrived for the first count days, hence it is perhaps not correct to consider these days as unsuitable for roding. However, this conclusion could apply for 9 April, which was both preceded and followed by an active evening.
According to the number of contacts only one male could have been roding up to 12 April. It is supposed that on 13 April two, and on 14 April already 4-5 males could have been participated.
The frequency distribution of count results (Figure 2) indicates four clusters. The clusters suggest that a male, when it was alone, performed an average of 2.5 flight rings per hour; when one additonal male participated the number of rings was 3.7, and in the case of three males 4.2 rings per male per hour. The number of rings depends on many factors, of course, but the number of males seems to be among major impacts. The two evenings with maximum number of counts suggest on average 4.5 rings per male; this high intensity could have occurred because of participation of females.
Mikk, R.
When do birds stop singing?
Summary: Based on systematic observations during more than ten years near Tõrva (Valga county) the author presents data on annual last dates when singing or territorial calls were heard.
Mägi, E.
Birding towers in Matsalu
Note
Elts, J.
A clutch with five eggs in the Redshank
EOS chronicle
Lõhmus, A., Kuresoo, A., Leibak, E., Leito, A., Lilleleht, V., Kose, M., Leivits, A., Luigujõe, L. & Sellis, U.
Status and numbers of Estonian birds
Summary: The paper gives an updated list of Estonian bird species, their status and numbers in breeding season and midwinter.
Methods
The estimates were evaluated as follows (hereafter the abbreviations as in Table 1).
Categories: A – species which has been recorded in an apparently wild state at least once since 1.1.1950; B – species which has been recorded in an apparently wild state only before 1950; C – released or escaped species which has established a self-supporting breeding population in the own country, also birds coming from category C population of another country; D – every other species unless it is almost certainly a genuine vagrant or almost certainly an escape from captivity; E – escapes from captivity.
Status: H – regular breeder; S – summer visitor; L – passage migrant; T – winterer; ( ) – irregular (breeder etc.); [ ] – occasional (breeder etc); E – vagrant; int – introduced. A species was considered occasional breeder/winterer etc. if its occurrence fitted in this pattern in 1950-1997. Irregular and regular breeders etc. were however determined by occurrence pattern in the last 20 years (1979-98) or (if status considerably changed during this period) according to the most recent years (e. g. Citrine Wagtail is a regular breeder although its first breeding dates back only to 1991).
No. of breeding pairs was taken as the common term of breeding population size, although in several species (e. g. gallinaceous birds, waders, raptors) pairs, in fact, were not counted. The minimum-maximum values consider both year-to-year variation (in some recent years) and inaccuracy of estimate. If numbers had changed unidirectionally in recent years, the estimate reflects the latest known situation (preferably in 1998).
Evaluation methods are shown for breeding estimates: 1 – complete count (a full or near-full census); 2 – expert estimate (the best estimate in the opinion of experts studying the population of the species); 3 – compilation (an estimate derived from a number of sources); 4 – extrapolation from sample surveys in different habitats and/or random plots; 5 – a rough method using the previous estimate (Lilleleht & Leibak 1993) and the known recent trend for correction (the previous method is indicated before / character, e. g. 2/5= previously expert estimate); 6 – a rough estimate from few quantitative data and densities in neighbouring countries (mainly Southern Finland).
Breeding estimate reliability is divided into three classes:
A – reliable quantitative data from recent years; B – generally well known, but quantitative data incomplete; C – very poor or missing (recent) quantitative data.
The changes in breeding populations (trends) are expressed as follows: e = extinct as a regular breeding bird during the study period; — = strong decrease (more than 50%); – = moderate decrease (10-50%); (-) = probable decrease (verification lacking); 0 = stable, no detectable change; (0) – probably stable; f = widely fluctuating, without steady trend; (+) = probable increase (verification lacking); + = moderate increase (10-50%); ++ = strong increase (more than 50%); (n) = newcomer with a few sporadic breeding records; n = newcomer as a regular breeding bird; ? = status largely unknown. In several cases also earlier (1971-90) trends were corrected if previously unknown data were available.
Winter numbers (individuals) are given according to January data, excluding years with extraordinary weather conditions. Most estimates are obviously very rough and (except for waterfowl) with unknown reliability.
Results
The estimates are shown in Table 1 (270kb). Some exotic and tamed species have been excluded from analyses.
As of 1.1.1998, 339 bird species have been recorded in Estonia (categories A-D), 222 of these are breeders (209 regular, 7 irregular and 6 occasional), 150 species have been observed in winter (94 regularly) and 212 species on migration (194 regularly).
329 species have occurred naturally, four of these (Gavia immer, Tetrax tetrax, Syrrhaptes paradoxus, Athene noctua) only before 1950. Three more species have occurred naturally in earlier times but recent records concern either escapes (Tadorna ferruginea) or birds with unknown origin (Gyps fulvus, Aegypius monachus). Seven species have probably always been escapes from captivity and two regular species (Columba livia, Branta canadensis) belong to category C. Four species (Pelecanus onocrotalus, Phoenicopterus ruber, Bucephala islandica, Bucanetes githagineus) are of unknown origin, as previously also Anser caerulescens (recent records concern escapes).
According to this study 7.9-15.7 million pairs of birds breed in Estonia, ten most common species making up 56-57% of this. Only 13 breeding species have been counted highly reliably, most of species with B-level reliability, and as many as 60 species with C-level reliability.
Recent addition rate of new breeding species seems lower than previously: in 1971-90 altogether 6 regular and 3 irregular new breeders settled in Estonia, compared to one species (Citrine Wagtail) in 1991-97. In 1971-90 69 species decreased and 77 species increased, in 1991-97 those numbers were 55 and 57, respectively. In this decade Falco columbarius, Charadrius dubius, Philomachus pugnax and Jynx torquilla have shown strong decrease, while Phalacrocorax carbo, Ciconia ciconia, Cygnus cygnus, Branta leucopsis, Haliaeetus albicilla, Tringa nebularia, Locustella luscinioides and Panurus biarmicus have shown strong increase.
Altogether, 2.4-8.6 million individuals were estimated to occur in midwinter, ten most numerous species making up 57-68% of this.
Table of status and numbers
Elts, J. & Tuule, E.
Changes in the numbers of winter birds in Saue
Lõhmus, A.
Does the Great Spotted Woodpecker build its nest economically?
Ader, A.
Birdwatchers and internet
Notes
Lõhmus, A.
A mallard bred in an occupied nest of Common Buzzard
Lõhmus, A.
An extraordinaly dark harrier
Elts, J. & Aua, J.
Yellow wagtails on migration
EOS chronicle and news
Edula, E.
Population changes of passerines in the surroundings of Viljandi in 1956-1995
Lõhmus, A.
Numbers of the Greater Spotted Eagle and the Lesser Spotted Eagle in Estonia
Leito, A.
The Common Crane in Estonia in 1997
Luigujõe, L., Kuresoo, A., Ader, A. & Ots, M.
Birds of Ropka-Ihaste floodplain meadow in 1992
Aua, J.
Interesting bird observations in 1977-1982
Elts, J., Aua, J.
How to determine the number of occupied burrows in Sand Martin colonies
EOS chronicle and news
- Eesti Ornitoloogiaühing
- Veski 4, Tartu 51005
eoy@eoy.ee
www.eoy.ee
Facebook
- Toimetus
- Peatoimetaja:
Jaanis Lodjak
Toimetuskogu:
Marko Mägi, Renno Nellis, Tuul Sepp, Jaanus Remm, Lauri Saks - Teabelehe kujundus:
Indrek Kalamees (Himanto)
- Veebileht: Hannes Margusson
- Tellimine: Eva-Liisa Orula
Ajakirja Hirundo väljaandmist toetab Keskkonnainvesteeringute Keskus.